Find optimal sites for renewable energy.
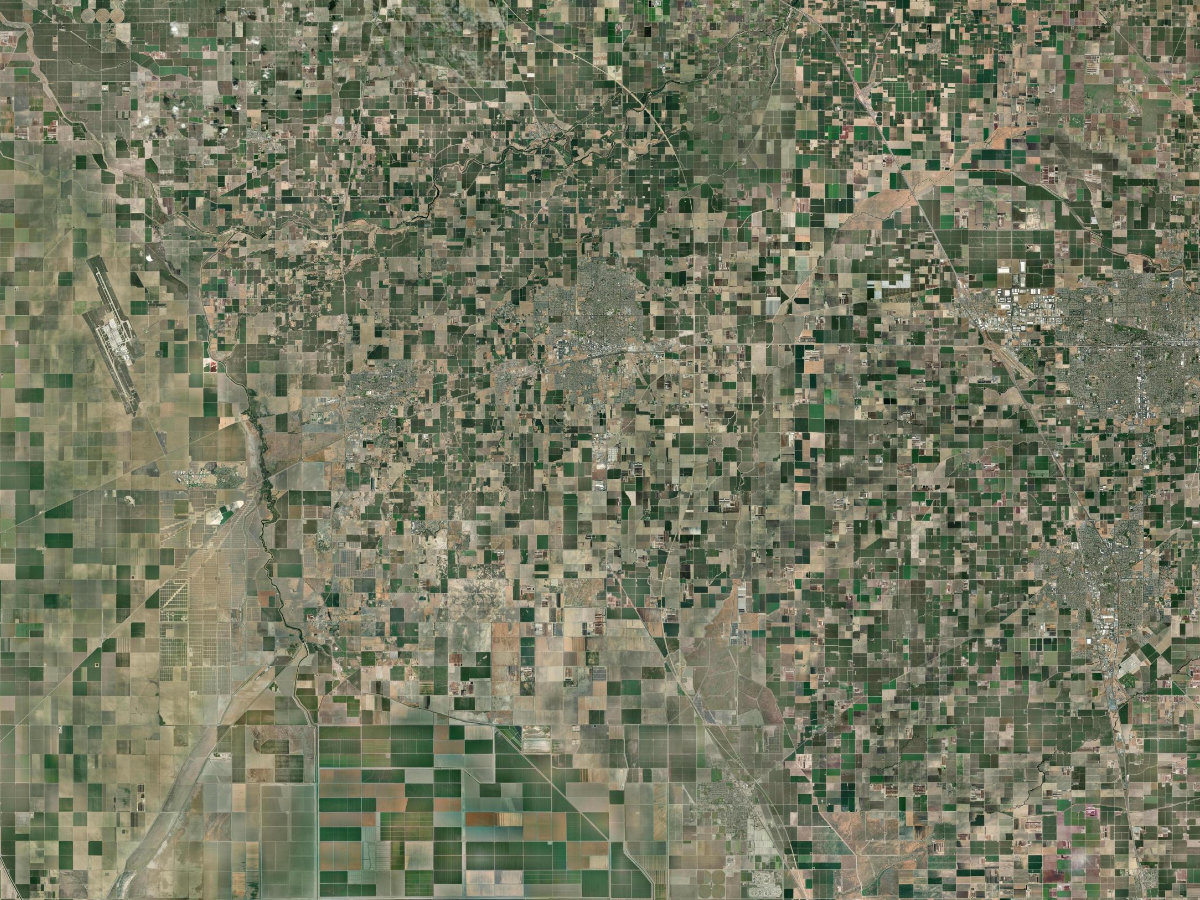
Rescape pairs satellite imagery with two decades of climate data to map candidate sites, segment the terrain, preview a solar build, and predict the energy a location can generate.
- Climate record
- 2001–24
- Land-cover classes
- 12
- Forecast to
- 2034
- Aerial segmentation · SegFormer
- Solar panel generation · Pix2Pix GAN
- GAN-driven site selection
- NASA POWER climate data · 2001–2024
- 12 land-cover classes
- Power & trend prediction
Survey
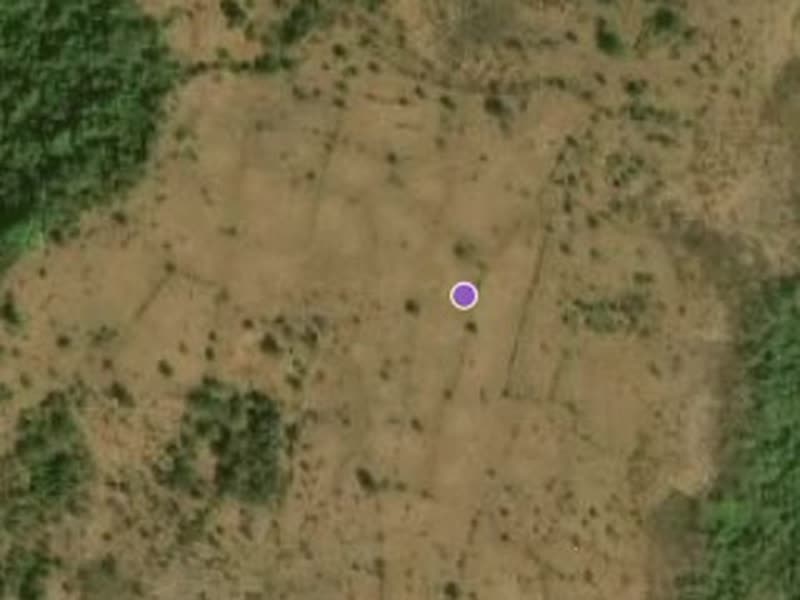
Draw an area on the map. Rescape pulls high-resolution satellite tiles and maps existing and candidate renewable sites in the region.
Segment
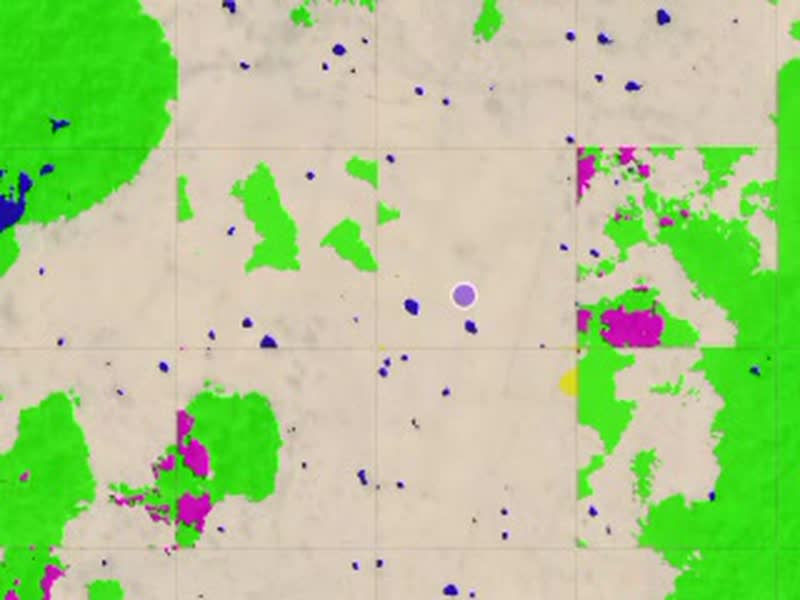
A fine-tuned SegFormer model classifies the terrain into 12 land-cover classes and measures the area of each.
Generate
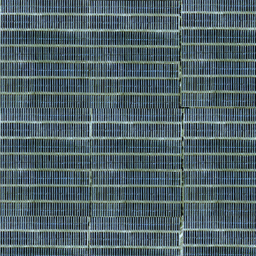
A Pix2Pix GAN renders how a solar array would sit on the buildable land, so the installation can be previewed before any site visit.
Predict
Two decades of NASA POWER climate data drive a model that predicts the site's energy output and projects its generation trend to 2034.
Map an area. See its potential.
From a boundary on the map to a land-cover breakdown, a solar-build preview, and a predicted energy output.
Open the site selector